Performance Monitoring Overview
This section provides an overview of the device's performance monitoring feature.
The device measures performance at fixed sampling intervals of 15 minutes. The interval’s start time is synchronized with the device’s clock so that intervals begin on the hour (e.g., 12:00). For example, there will be an interval at 12:00, 12:15, 12:30, 12:45, 13:00, and so on. In addition to the current 15-minute interval, the device always stores a record of at least the last two completed intervals.
The device provides two main performance monitoring parameters - those that display real-time values measured in the latest interval and those that display historical measurements from passed, stored intervals. Most historical performance monitoring parameters provide statistical information from up to the last four stored intervals (i.e., an hour). However, some historical performance monitoring parameters provide statistical information from up to 100 stored intervals (i.e., 25 hours). Stored intervals are referred to as retention policy. Therefore, this allows you to retrieve measurements collected in a specific stored interval. Retrieving values from historical intervals is supported by the device's CLI, REST API, and SNMP. For more information, see Querying Historical Performance Monitoring Intervals and Values
| ● | If your device's clock is synchronized by an NTP server, it's likely that the last interval within the first hour after device startup will be cut short to accommodate for clock synchronization. |
| ● | Historical performance monitoring parameters of IP Groups are only available from the third collection interval after device restart |
You can access the performance monitoring parameters through the device's Web-based management interface, CLI, REST API, SNMP, or OVOC.
For SNMP management, the device supports SNMPv1, SNMPv2, and SNMPv3. SNMPv2 or SNMPv3 is required to query 64-bit counters because SNMPv1 doesn't support 64-bit counters (per RFC 2233). Therefore, to ensure that your SNMP Get requests for performance monitoring parameters are successful, it's recommended to use SNMPv2 or SNMPv3.
The hierarchical structure of this document represents the hierarchical structure (tree) of the device's performance monitoring parameters, as shown below:
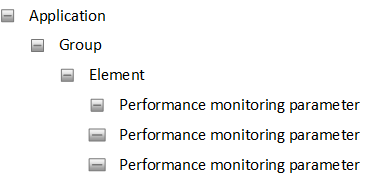
| ■ | Application: First (highest) tier in the hierarchical tree and represents the application to which the performance monitoring parameters belong (System, SBC, Media, Network, or Gateway). |
| ■ | Group: Second tier in the hierarchical tree and represents the group to which the performance monitoring parameters belong (e.g., System > licenseStats). |
| ■ | Element: Third (lowest) tier in the hierarchical tree and represents the subgroup to which the performance monitoring parameters belong. The actual performance monitoring parameters are located under this subgroup. Each performance monitoring typically has multiple elements (entities). For example, SBC call statistics has three entities -- "global", "IP Group", and "SRD"-- thereby providing three separate real-time performance monitoring parameters that measure the same thing, but per entity (all, IP Group , and SRD). If the Group level doesn't need subgroups for its performance monitoring parameters, only a single Element level is provided, which is called "global" (e.g., System > licenseStats > global > licenseFeuUsageAvg). |
| ■ | Performance Monitoring parameters: The performance monitoring parameters are located under the Element tier. |
Throughout this document, each performance monitoring parameter provides a table with the following fields:
|
Field |
Value |
||||||||||||
|---|---|---|---|---|---|---|---|---|---|---|---|---|---|
|
Parameter Name |
Displays the general name of the performance monitoring parameter (e.g., cpuUtilizationAvg). |
||||||||||||
|
Type |
Displays the type of performance monitoring parameter:
|
||||||||||||
|
Calculation Type |
Displays the calculation type:
|
||||||||||||
|
Realtime / History |
Indicates if the performance monitoring parameter is one of the following:
|
||||||||||||
|
Supported Platforms |
Displays the supported SBC device models. |
||||||||||||
|
Retention Policy |
Displays how many 15-minute sampling intervals are stored for the specific performance monitoring parameter. For example, a retention policy of 4 means that the sampling values of only the last four intervals are stored. Note: Only historical (not real-time) performance monitoring parameters have retention policies. |
||||||||||||
|
Web Name |
Displays the name of the performance monitoring parameter in the Web interface (e.g., History/System/CPU Stats/CPU/CPU Utilization Avg). |
||||||||||||
|
CLI Name |
Displays the name of the performance monitoring parameter in the CLI (e.g., show kpi interval (index) system cpustats cpu (index) cpuutilizationavg(index)(index)). |
||||||||||||
|
REST Name |
Displays the name of the performance monitoring parameter in the REST API (e.g., /api/v1/kpi/history/system/cpuStats/cpu/(index)/cpuUtilizationAvg?interval=(index)(index)). |
||||||||||||
|
SNMP Name |
Displays the name of the performance monitoring parameter the SNMP interface (e.g., acKpiSystemCpuStatsIntervalCpuCpuUtilizationAvg). |
||||||||||||
|
SNMP OID |
Displays the SNMP OID (e.g., 1.3.6.1.4.1.5003.15.2.6.1.1.3). |
||||||||||||
|
Description |
Provides a description (what it measures) of the performance monitoring parameter. |